C.O. Williams Construction Limited are a heavy civil engineering contractor based in Barbados in the Caribbean, currently employing 260 staff. Our contracts include road building, landfill cell construction, coastal defence works, marine works, airport runway and taxiway construction and resurfacing, property development subdivisions, golf course construction, substructure and external works, and the like.
We have been using NRG Survey System and Digital Terrain Mapping software since 1998 and they have become an essential part of our workflow. The software is employed by our Quantity Surveyors, Land Surveyors and Managers, and seamlessly integrates the design, setting out and measurement aspects of our work, allowing us to be more efficient and in better control of the tasks in hand.
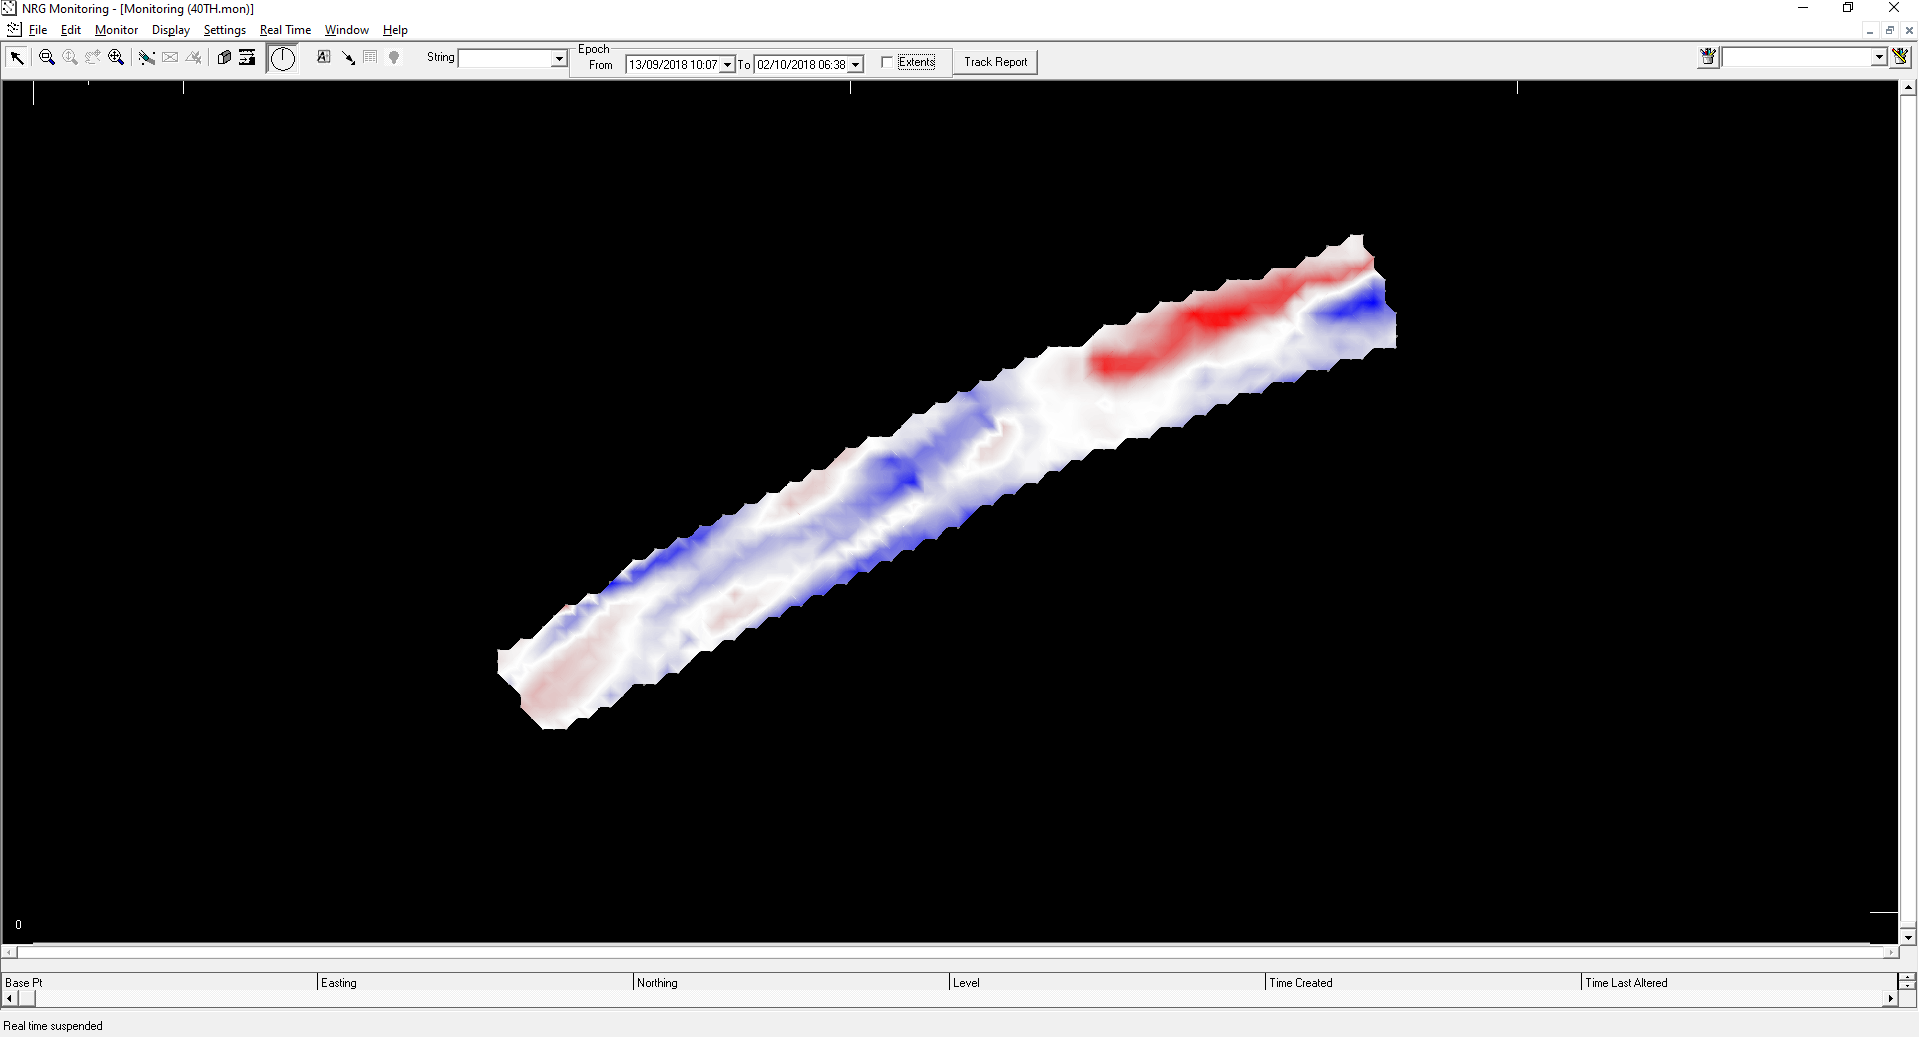
We are frequently asked to provide budget costings for projects with scant information and no Bills of Quantities. With NRG we are able to carry out a topographical survey of the proposed site, establish top of rock levels from test pits, input the design including finished levels, and from this data calculate the necessary quantities required for the estimate. We are also able to produce 3D renderings and cross sections through the site for the client and highlight any problem areas that might exist. DTM Map allows us to determine changes to the consultant’s proposed earthworks design to balance cut and fill requirements, thus saving the client money, a service which is greatly appreciated. We have found that we can use the software for applications outside of the intended purchase function; an example of which was the design for the extension of the runway on Mustique. Measurement for valuation purposes is another of the software’s strengths, with volume calculations being a particularly powerful tool. Data can be presented in many ways, from cross sections to levels on a set grid within different models, allowing the client’s representative to check and confirm quantities easily, saving both time and effort in agreeing the final account.
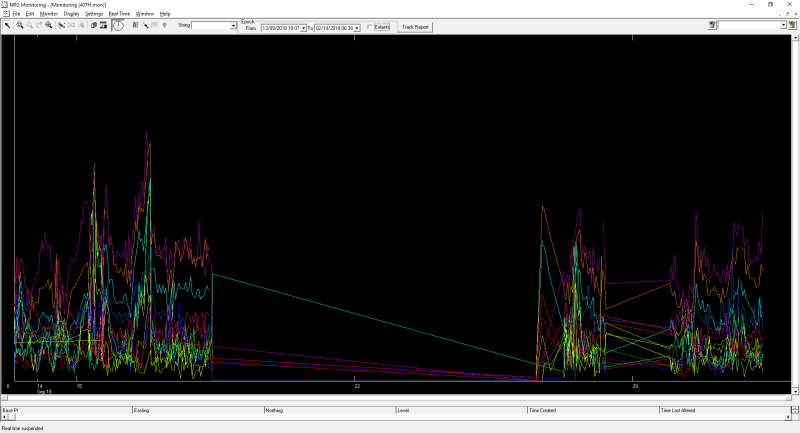
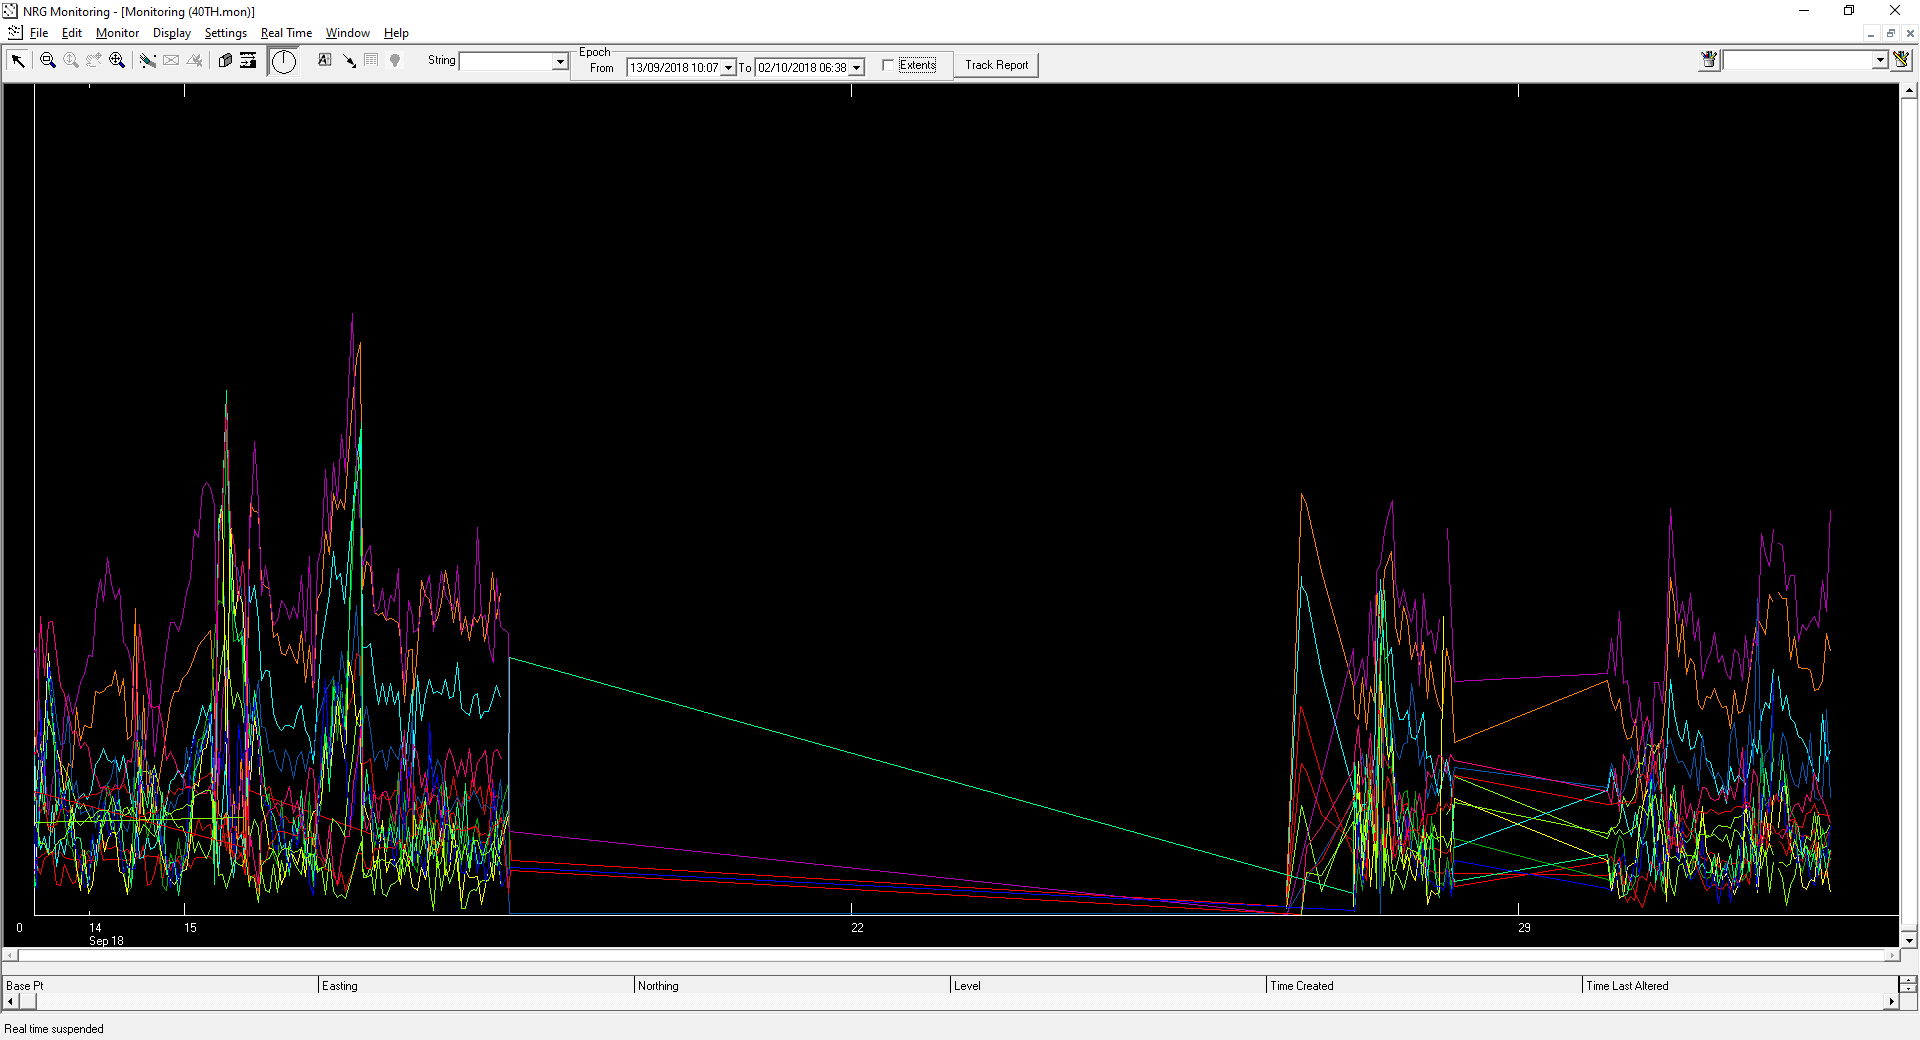
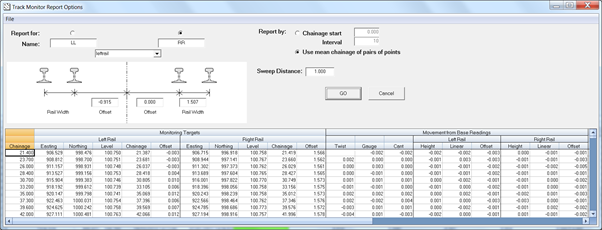
On site NRG is extremely user friendly, straight forward and easy to use, and saves our surveyors a considerable amount of time in the field. One aspect they comment on is that once the horizontal and vertical string information has been entered, any point within the proposed survey can be interrogated for chainage, offset, proposed height and the amount of cut or fill required.
The use of strings is extremely versatile, and our surveyors employ them for many applications, even for setting out building gridlines. Client support is another of NRG’s major strengths, and we can speak with one of the programmers should we have a query. This attention to our needs we find invaluable, and unique in an industry dominated by large, faceless software houses.
We are also able to suggest features we would like to see in the software, and this will be taken into consideration and often acted upon and incorporated in future releases. The annual User Group meeting is a good forum to be brought up to date on the latest software release, which I can attest to, having attended every one since their inception in 2003. Of particular value is the ability to have one on one sessions with the programmers for training or advice on any aspect of the software. If I had to sum up the NRG suite of software it would be: powerful, intuitive and user friendly, and for us, indispensable
Quantity Surveyor, C. O. Williams